

National transit ridership sits at about 82 percent of pre-pandemic levels. On the surface, that looks like a recovery. The underlying economics tell a different story. Farebox recovery ratios—how much of operating costs are covered by fares—average just 16 percent nationally and 31 percent among the ten largest US agencies, both well below pre-pandemic norms. The riders who generated the most revenue have not returned in the same numbers. That shift is undermining the funding model transit agencies have depended on for decades.
The Recovery Number That Hides the Real Problem
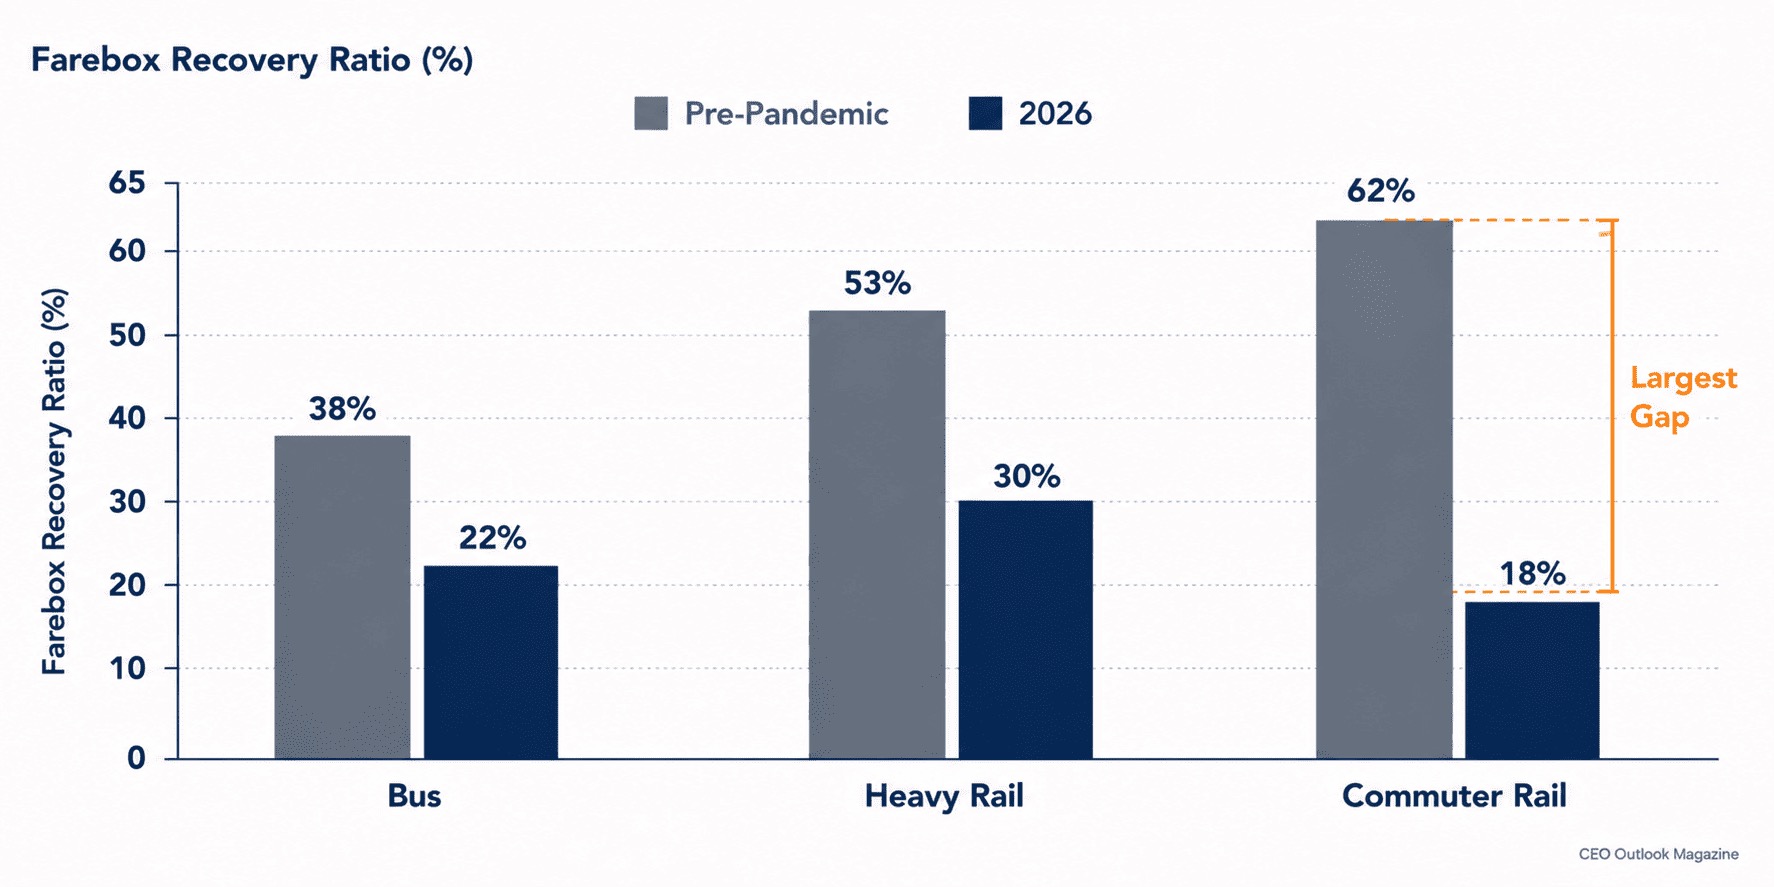
The gap between ridership recovery and farebox revenue is not a short-term issue. It is a structural change affecting every mode. Bus systems that once covered 28 to 35 percent of costs through fares now cover only 22 to 28 percent. Heavy rail has dropped from 45 to 55 percent down to 35 to 45 percent. Commuter rail, previously the strongest performer at 55 to 65 percent, now sits at 40 to 55 percent. These declines are driving persistent operating deficits that fare adjustments alone cannot fix. The core issue is a shift in who rides and what they pay.
Why the Model Was Never Actually Designed for This
BART’s history makes the risk clear. Its farebox recovery ratio was once the benchmark for US transit, nearly covering operating costs through fares. That model relied on a stable base of peak-hour commuters. Today, with San Francisco’s workforce about 50 percent remote, peak ridership has collapsed and farebox revenue is roughly half of pre-pandemic levels. The highest-value riders were also the most able to stop commuting. Funding models built around their reliability were never designed to withstand this kind of loss.
The Real, Dated, Quantified Stakes Right Now
The financial impact is immediate. BART projects a $375 million structural deficit for fiscal 2027. SEPTA faces a $200 to $250 million shortfall, with labor costs rising 3.5 to 4 percent annually while farebox recovery remains at 14 to 15 percent. TriMet in Portland is looking at a $300 million deficit. Chicago-area agencies face a nearly $800 million gap that could force service cuts of up to 40 percent. WMATA in Washington DC has a $400 million deficit. These gaps are widening as federal pandemic-era funding expires. The Infrastructure Investment and Jobs Act’s nominal funding increase has been eroded by inflation, especially from 2021 to 2023. The next federal surface transportation reauthorization will arrive as both federal and local finances are under strain.
Why Some Regions Are Weathering This and Others Aren't
The crisis is not uniform. Regional economic conditions, not just remote work trends, explain the differences. Systems in regions with real employment growth are recovering faster. Sound Transit in Seattle, with 2.5 percent employment growth, reports 95 percent ridership recovery. Los Angeles Metro, in a region growing 2.2 percent, reports 89 percent. Philadelphia, with employment down 0.5 percent, reports only 76 percent. Transit funding now depends directly on whether the local economy is growing. Agencies planning major expansions based on 95 percent or higher ridership recovery are making an assumption that holds in only a few markets.
What's Actually Working, and What Isn't
Some interventions are working, but not all address the core funding problem. Sound Transit’s 2023 bus network redesign increased ridership by 12 percent and cut costs by 8 percent, showing that service redesign can improve both revenue and expenses. Fare-free programs have not proven durable. Kansas City’s fare-free transit saw a 22 percent ridership increase in its first year, but those gains disappeared when fiscal pressure returned. Eliminating fares simply moves the funding problem elsewhere. New York’s congestion pricing, launched in January 2025 at a $9 peak-hour toll, is a new funding mechanism being tested as bridge financing. Illinois has responded by restructuring its regional transit governance, replacing the Regional Transportation Authority with the Northern Illinois Transportation Alliance effective June 2026.
What This Means for Transportation and Public Finance Leadership
Transit systems built around farebox revenue from predictable peak commuters are now operating on a business model that hybrid work has permanently changed. The agencies adapting are not waiting for old commuting patterns to return. They are diversifying funding, redesigning service for current travel patterns, and grounding capital plans in realistic, region-specific ridership assumptions. The pre-pandemic baseline is unlikely to return in most markets.
Many organizations are still planning around pre-pandemic ridership assumptions. The risk is clear: capital plans built on outdated baselines are unlikely to hold. The financial pressures reshaping public transportation require a more grounded approach.