

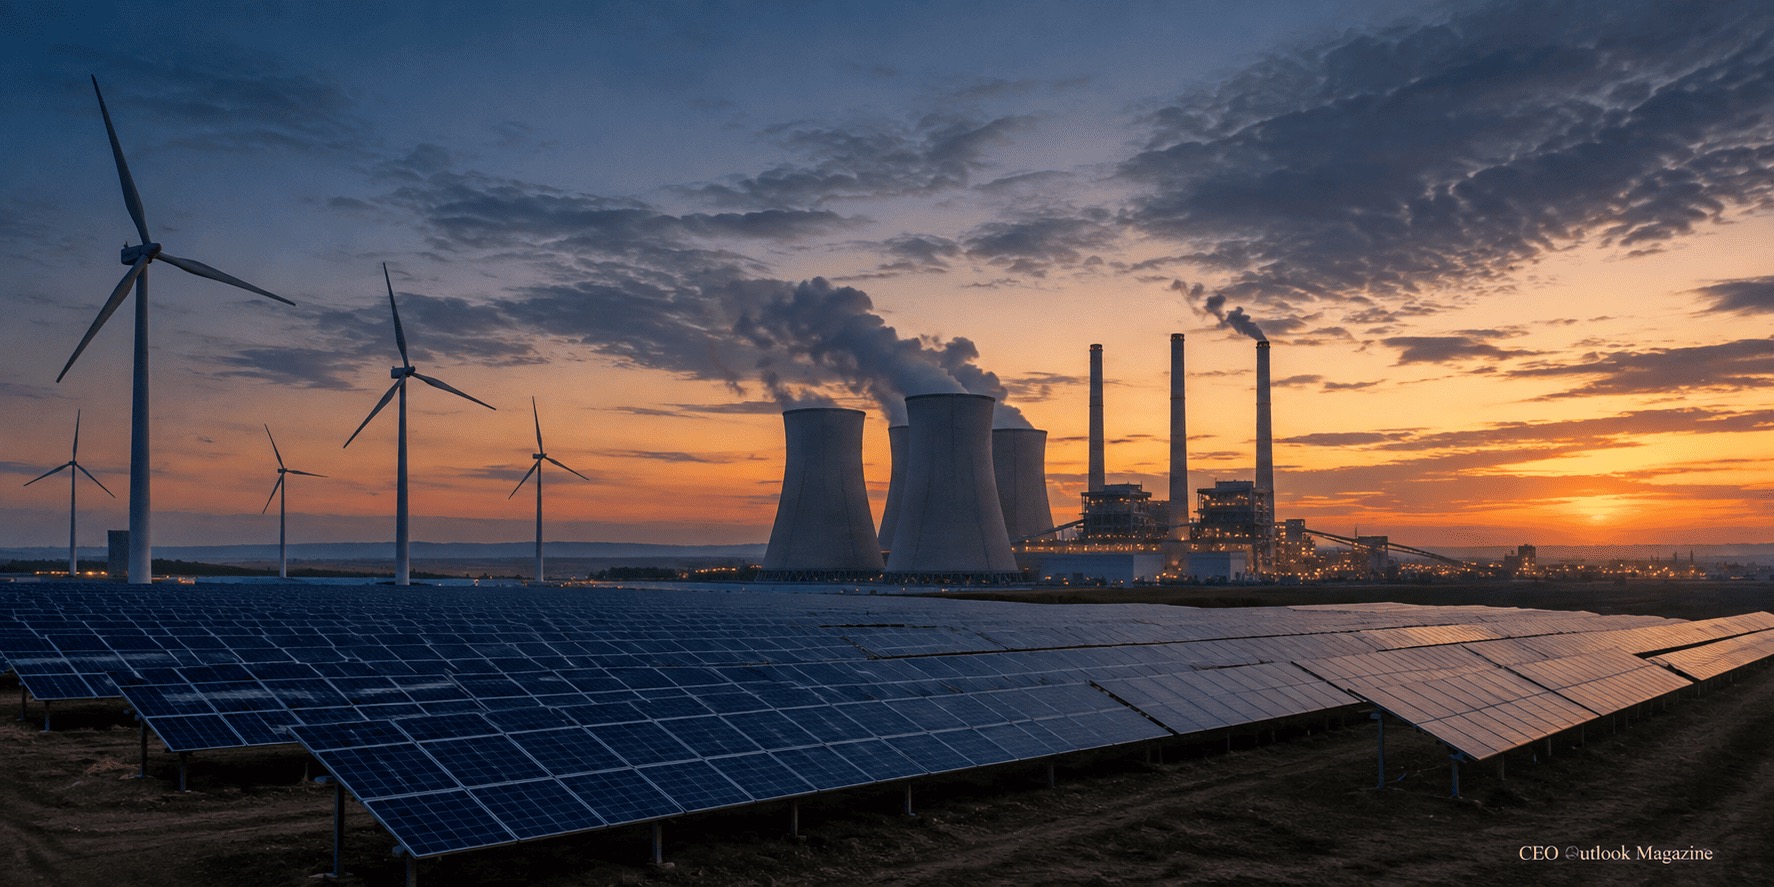
Clean energy investment reached a record US$2.3 trillion in 2025, outpacing fossil fuels by about two to one. Yet in the same year, fossil fuel consumption and global carbon emissions both increased. Demand for coal, oil, and natural gas also grew. These facts coexist. Understanding the energy transition requires looking beyond investment totals and confronting the reality that capital flows and physical energy use are diverging. tands.
The Number Investment Headlines Lead With
The capital case for clean energy is real. Global energy investment is projected at US$3.4 trillion in 2026, with about US$2.2 trillion—nearly two-thirds—allocated to renewables, nuclear, grids, storage, and efficiency. Fossil fuels account for roughly US$1.2 trillion. Independent sources, including BloombergNEF, confirm the same trend: US$2.3 trillion in global transition investment in 2025, up 8 percent year over year. On investment alone, the transition story is well supported—a Very Different Story.
The physical energy system tells a considerably less triumphant story. Fossil fuels supplied roughly. The physical energy system is changing more slowly. Fossil fuels supplied about 94 percent of global commercial energy in 1965 and still account for around 80 percent today—a share that has remained largely unchanged for decades, with only brief reversals. The 2026 Energy Institute Statistical Review puts fossil fuels at roughly 86 percent of total global energy in 2025. Nuclear, hydro, and renewables remain a modest share of a system measured in hundreds of exajoules. Despite record clean energy additions, fossil fuel consumption and carbon emissions both rose in 2025. The carbon intensity of global energy has barely shifted, declining only marginally year over year, even as renewable capacity expands. As once stated plainly: global energy demand keeps growing faster than clean energy can displace the fossil fuels already embedded in the system. Clean energy sources covered less than 40 percent of the total growth in global energy demand in recent analyses, meaning fossil fuels still had to supply most new demand even as renewables expanded at a record pace in relative terms. New clean energy capacity is, in large part, being layered on top of a fossil fuel base that itself keeps expanding, rather than genuinely displacing existing fossil fuel use in absolute terms. This is the core distinction the headline investment figures obscure: rapid percentage growth in a still-small base does not automatically translate into a shrinking fossil fuel system when the total pie itself keeps getting larger.
Where the Progress Is Actually Real
This does not mean the transition is failing. The electricity sector, in particular, is making real progress. In 2025, renewables generated 34 percent of global electricity, surpassing coal for the first time in recorded history. With nuclear included, fossil-free sources reached 43 percent of global electricity generation. In the European Union, solar and wind accounted for 30 percent of electricity, overtaking fossil fuels in the power mix. Solar PV became the largest single source of global energy demand growth in 2025, and the 600 terawatt-hour increase in solar generation was the largest annual gain outside a post-crisis recovery. Electricity is leading the transition. The rest of the energy system—transport, industrial heat, and heating—remains largely unchanged and moves much more slowly, a reality headline percentages often miss.
The Uneven Regional Reality
Even in electricity, progress is uneven by region. China's coal-fired generation share dropped to 55 percent in 2025, down from 70 percent a decade earlier. India's coal share declined more slowly, from 76 percent to 71 percent. In Southeast Asia, coal's share increased from 37 percent to 48 percent over the same period. The global transition narrative often overlooks regions where fossil fuel use is still rising.
The Subsidy Gap Nobody's Fixed
Policy continues to favor fossil fuels, even as clean energy investment surpasses it in dollar terms. In 2023, governments spent about US$620 billion subsidizing fossil fuel consumption, compared to US$70 billion for consumer adoption of electric vehicles, heat pumps, and efficiency upgrades—a nearly nine-to-one gap. The International Monetary Fund estimates explicit fossil fuel subsidies at US$0.73 trillion in 2024, and the implicit subsidy—the unpriced costs of pollution, climate damage, and congestion—at about US$6.7 trillion. Fossil fuels are not competing on a level playing field. Structural underpricing still drives real-world energy choices, regardless of investment headlines.
What This Means for Energy Leadership
For energy sector leadership, the honest read is neither triumphalist nor dismissive. The transition is genuinely underway, and progress in electricity generation is real and accelerating. The transition is underway, and progress in electricity generation is real and accelerating. But the overall pace is slower than investment headlines suggest, because total energy demand is growing faster than clean sources can replace fossil fuels in transport, industry, and heating. Strategies that assume rapid grid decarbonization or broad fossil fuel displacement based on headline investment figures risk relying on the wrong data. Share your perspective — share your view with our editorial team, and subscribe to our newsletter for more coverage on the real pace of the global energy transition.